Understanding Weather Code Icons: What Each Symbol Means
Master marine weather symbols and learn to read forecasts like a professional mariner
You check your weather app at 0600. The screen shows a series of icons: partly cloudy becoming overcast, then rain, then thunderstorms by evening. But what do these symbols actually tell you? More importantly, what aren’t they telling you?
Weather icons are the visual shorthand of marine forecasting. They compress complex atmospheric conditions into simple symbols. But here’s the challenge: not all icons mean what you think they mean, and the difference between “cloudy” and “overcast” can determine whether you leave the dock or wait another day.
Mariner Studio uses a professional approach: standardized WMO (World Meteorological Organization) weather codes translated into clear, intuitive icons designed specifically for marine use. You get the precision of global weather standards with the clarity of purpose-built maritime symbols.
Understanding Weather Code Systems
Mariner Studio uses the World Meteorological Organization (WMO) weather code system as its foundation—the global standard for weather reporting used by professional meteorologists worldwide. When you understand these codes, you’re reading the same language as ship captains, commercial fishermen, and weather forecasters.
The WMO codes range from 0 (clear sky) to 99 (thunderstorm with heavy hail). Mariner Studio receives these standardized codes from the Open-Meteo weather API and translates them into clear, custom-designed weather icons optimized for maritime use. These aren’t the official WMO symbols (which frankly look dated)—they’re purpose-built icons that combine professional meteorological precision with modern visual clarity.
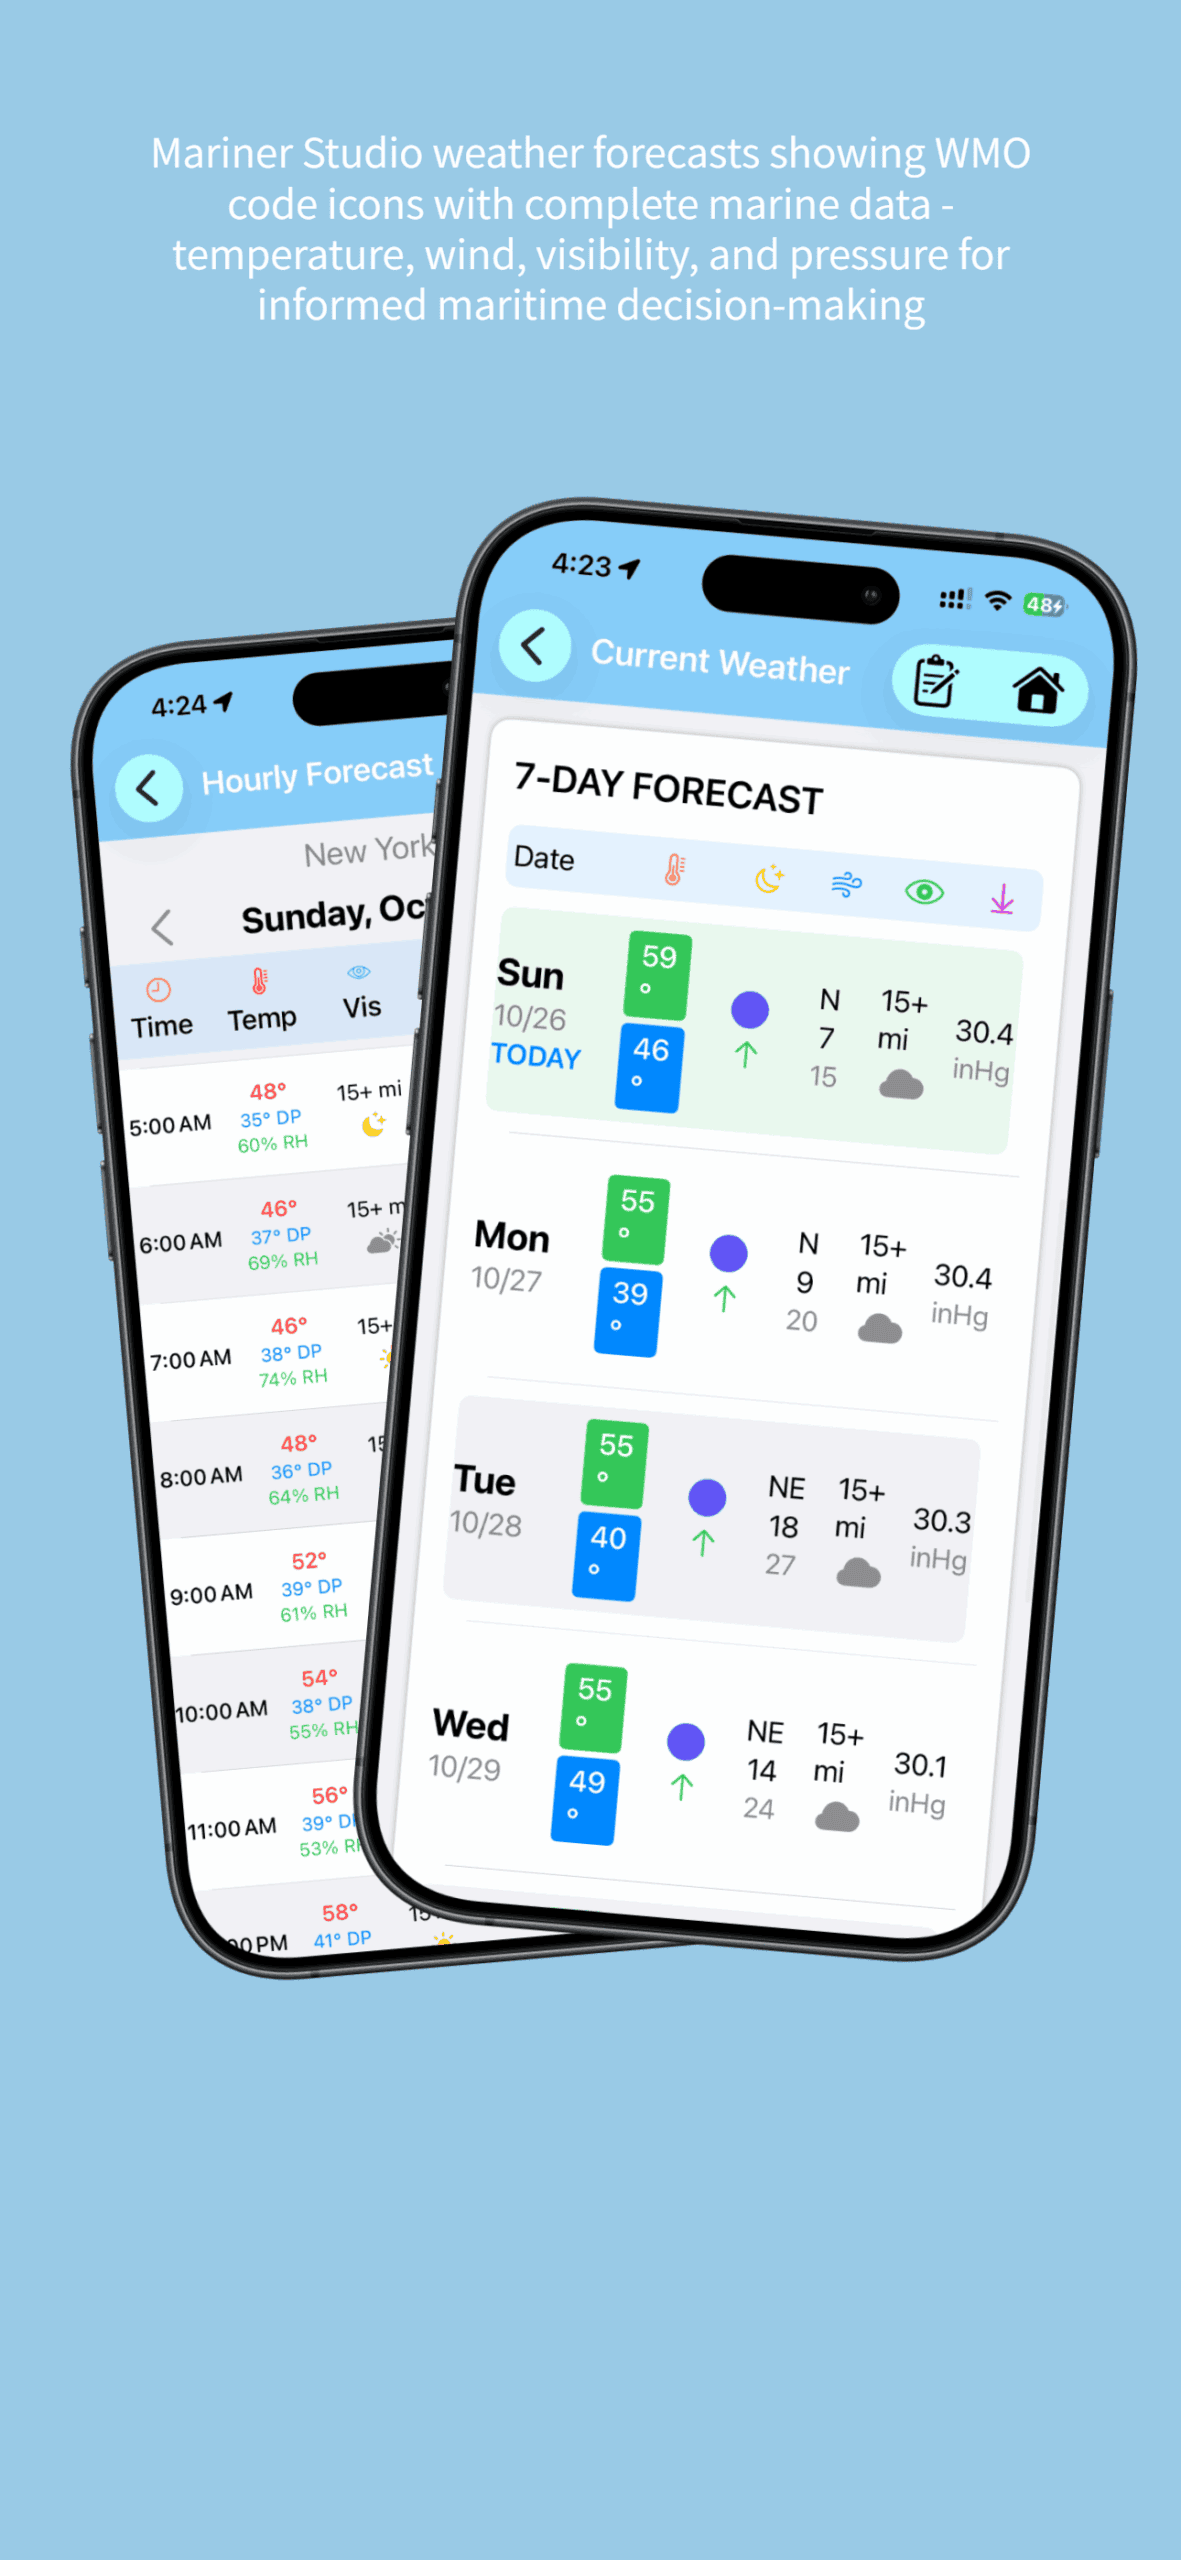
Hourly and 7-day forecasts with WMO weather icons and complete marine data for passage planning.
Here’s what matters: every icon represents a specific WMO code that corresponds to actual observed or forecast conditions. When you see a thunderstorm icon, you’re looking at forecast data indicating WMO codes 95-99, which represent convective activity with measurable electrical discharge. The icon is custom-designed for clarity, but the underlying data is pure meteorological science.
Clear Sky vs. Partly Cloudy vs. Overcast
These three icons seem straightforward, but they represent dramatically different conditions at sea. Understanding the distinction changes how you plan every passage.
Clear Sky (WMO Code 0-1)

Clear sky icon (WMO Code 0-1) – Less than 10% cloud cover
Clear sky means 0-10% cloud cover. At sea, this gives you maximum visibility, reliable celestial navigation if you’re old school, and predictable temperature patterns. Clear nights mean rapid heat loss, which can create morning fog in certain conditions. Clear days mean strong solar heating, which affects afternoon wind patterns.
For passage planning, clear skies are your friend. You’ll have good visibility for traffic avoidance, clear sight of weather systems approaching, and reliable forecasted conditions. The barometric pressure trend matters more than the clear sky itself—clear weather under high pressure is stable, but clear weather with falling pressure means change is coming.
Partly Cloudy (WMO Code 2-3)

Mainly clear icon (WMO Code 1) – Few clouds, 10-25% cloud cover

Partly cloudy icon (WMO Code 2) – Scattered clouds, 25-50% cloud cover
Partly cloudy indicates 10-50% cloud cover. This is where interpretation becomes crucial. Scattered fair-weather cumulus clouds are entirely different from scattered stratocumulus that might be the leading edge of an approaching front. The icon tells you coverage, but you need to look at trends and other data.
In Mariner Studio, check the hourly forecast progression. If partly cloudy is becoming overcast, you’re watching a system move in. If partly cloudy is becoming clear, you’re seeing a system move out. The direction of change matters more than the current condition.
Overcast (WMO Code 4-5)

Overcast icon (WMO Code 3) – Broken to overcast clouds, 50-100% cloud cover

Heavy overcast icon (Legacy code 804) – Complete overcast, 85-100% cloud cover
Overcast means 90-100% cloud cover. At sea, this matters because it eliminates visual cues for weather changes. You can’t see approaching squalls. You can’t gauge wind shifts by watching cloud movement. Your entire weather awareness shifts from visual observation to data interpretation.
Overcast conditions also affect visibility more than you’d expect. Heavy overcast can reduce contrast, making it harder to judge distance and sea state. If you’re navigating with landmarks, overcast days require closer attention to GPS and charts.
Rain, Drizzle, and Showers: Reading Precipitation Icons
Precipitation icons seem simple—water falling from the sky—but they indicate very different conditions and risks at sea. The distinction between drizzle, rain, and showers isn’t about how wet you get. It’s about what atmospheric conditions produce that moisture and what else might be happening.
Drizzle (WMO Code 50-59)

Drizzle/Showers icon (WMO Code 51-55) – Light precipitation, small droplets
Drizzle indicates small water droplets (less than 0.5mm diameter) falling from stratus clouds. This matters because drizzle comes with reduced visibility—often the primary hazard. You’re not dealing with heavy weather, but you might be dealing with fog, low ceilings, and poor contrast.
In coastal waters, drizzle conditions require heightened traffic awareness. Your visibility might drop from 5 miles to 1 mile without dramatic weather changes. Watch for the drizzle icon combined with “mist” or low visibility values in Mariner Studio’s detailed forecast.
Rain (WMO Code 60-69)

Rain icon (WMO Code 61-65) – Steady continuous precipitation
Rain indicates larger droplets falling continuously from nimbostratus or deeper stratus clouds. Light rain is manageable. Moderate to heavy rain reduces visibility significantly and can create radar clutter if you’re using onboard radar for traffic separation.
The key distinction: rain is continuous. When you see the rain icon, expect sustained precipitation. This affects your clothing strategy, equipment protection, and crew morale on longer passages. Plan ahead—once it starts, it might continue for hours.
Showers (WMO Code 80-84)
Showers icon (WMO Code 80-82) – Intermittent convective precipitation
Showers indicate precipitation from convective clouds—cumulus or cumulonimbus. Unlike continuous rain, showers are brief and intense. They come, they dump, they move on. The icon pattern in Mariner Studio will often show alternating shower and partly cloudy symbols through the day.
For mariners, showers mean rapidly changing conditions. You might have clear weather one minute and poor visibility with gusty winds the next. The shower icon is your warning to watch the horizon, monitor radar if equipped, and be ready for quick wind shifts.
Snow and Sleet (WMO Code 70-79)

Snow icon (WMO Code 71-77, 85-86) – Frozen precipitation, snow fall and snow showers
In higher latitudes or winter coastal cruising, frozen precipitation creates unique challenges. Mariner Studio displays distinct icons for snow, freezing rain, and sleet because each requires different preparations.
Snow: Crystallized precipitation that accumulates. The primary risk is topside weight affecting stability and coating equipment. In heavy snow, visibility drops to near zero.
Freezing rain/drizzle: The most dangerous precipitation at sea. Supercooled water droplets freeze on contact with your vessel, creating ice accumulation that’s hard to remove and builds faster than snow. A few hours of freezing rain can create critical stability issues on smaller vessels.
Sleet: Ice pellets that bounce rather than stick. Less dangerous than freezing rain but still a warning that you’re in below-freezing conditions with moisture present.
Thunderstorm Icons: Understanding Convective Weather

Thunderstorm icon (WMO Code 95-99) – Convective activity, lightning, heavy rain
Thunderstorm icons (WMO codes 95-99) indicate convective activity with electrical discharge. At sea, thunderstorms present multiple hazards: lightning strikes, sudden wind shifts, waterspouts, heavy precipitation reducing visibility, and occasionally hail.
What the Thunderstorm Icon Really Means
When Mariner Studio shows a thunderstorm icon, you’re looking at forecast convective activity. The app might show variations—thunderstorms with rain, thunderstorms with hail—but all indicate unstable atmospheric conditions with vertical cloud development.
Here’s what you need to know operationally: thunderstorms at sea often move faster than forecast because there’s less friction over water. The icon gives you the warning, but you need to monitor radar (if equipped) or maintain visual vigilance for developing cells. Dark cloud bases, increased wind, sudden temperature drops, or pressure changes all indicate nearby thunderstorm activity.
Timing Thunderstorm Arrival
Unlike frontal rain that arrives on schedule, thunderstorms can develop earlier or later than forecast. Use Mariner Studio’s hourly view to see when thunderstorms are most likely, but don’t treat this as exact timing. If afternoon thunderstorms are forecast and you see towering cumulus developing by noon, they’re building earlier than predicted. Trust observation combined with forecast data.
The progression matters: partly cloudy to cloudy to thunderstorms indicates destabilization. If the morning forecast showed afternoon thunderstorms but by 1000 you’re still seeing clear skies, the instability might not develop as forecast. Weather is probability, not certainty.
Fog and Mist: The Visibility Icons
Fog and mist icons indicate reduced visibility, but they’re forecast less reliably than other conditions because fog formation depends on precise dewpoint and temperature relationships that can vary over short distances.
Mist (WMO Code 10)

Mist/Fog icon (WMO Code 45, 48) – Reduced visibility, 1-6 miles for mist
Mist indicates visibility reduced to 1-6 miles by water droplets suspended in the air. You can still see reasonably well, but distances are deceptive. Lights appear closer than they are. Other vessels might materialize faster than expected.
For mariners, mist conditions mean slowing down and increasing watch vigilance. Use radar if equipped. Make security calls on VHF if in traffic lanes. The mist icon in Mariner Studio is your early warning to prepare for reduced visibility before it becomes critical.
Fog (WMO Code 11-12)
Fog icon (WMO Code 45, 48) – Visibility below 1 mile, dense fog conditions
Fog indicates visibility below 1 mile, sometimes near zero. At sea, this is one of the most dangerous conditions you’ll face. Collision risk increases dramatically. Navigation requires complete reliance on instruments. Sound signals become mandatory under collision regulations.
When Mariner Studio shows fog in your forecast, pay attention to the timing. Radiation fog typically forms at night and burns off mid-morning. Advection fog—warm moist air moving over cold water—can persist for days and doesn’t follow a diurnal pattern. Check the temperature and dewpoint values in the detailed forecast. If they’re close (within 2-3°F), fog is likely regardless of what the icon shows.
Using Icons in Context: The Complete Picture
Individual weather icons tell part of the story. The full picture comes from reading icons in context with other forecast data and understanding trends.
Icon Progression Analysis
Open Mariner Studio’s hourly forecast and look at icon progression over 12-24 hours. Are conditions improving or deteriorating? Fast changes indicate strong weather systems. Slow changes or steady icons indicate stable pattern.
Example progression: Clear sky → Partly cloudy → Overcast → Rain → Thunderstorms over 12 hours indicates an approaching cold front. Each icon is a milestone telling you where you are in the system’s arrival.
Reverse progression: Thunderstorms → Heavy rain → Light rain → Overcast → Partly cloudy → Clear represents a front passage. The icons tell you the system is moving through and conditions are improving.
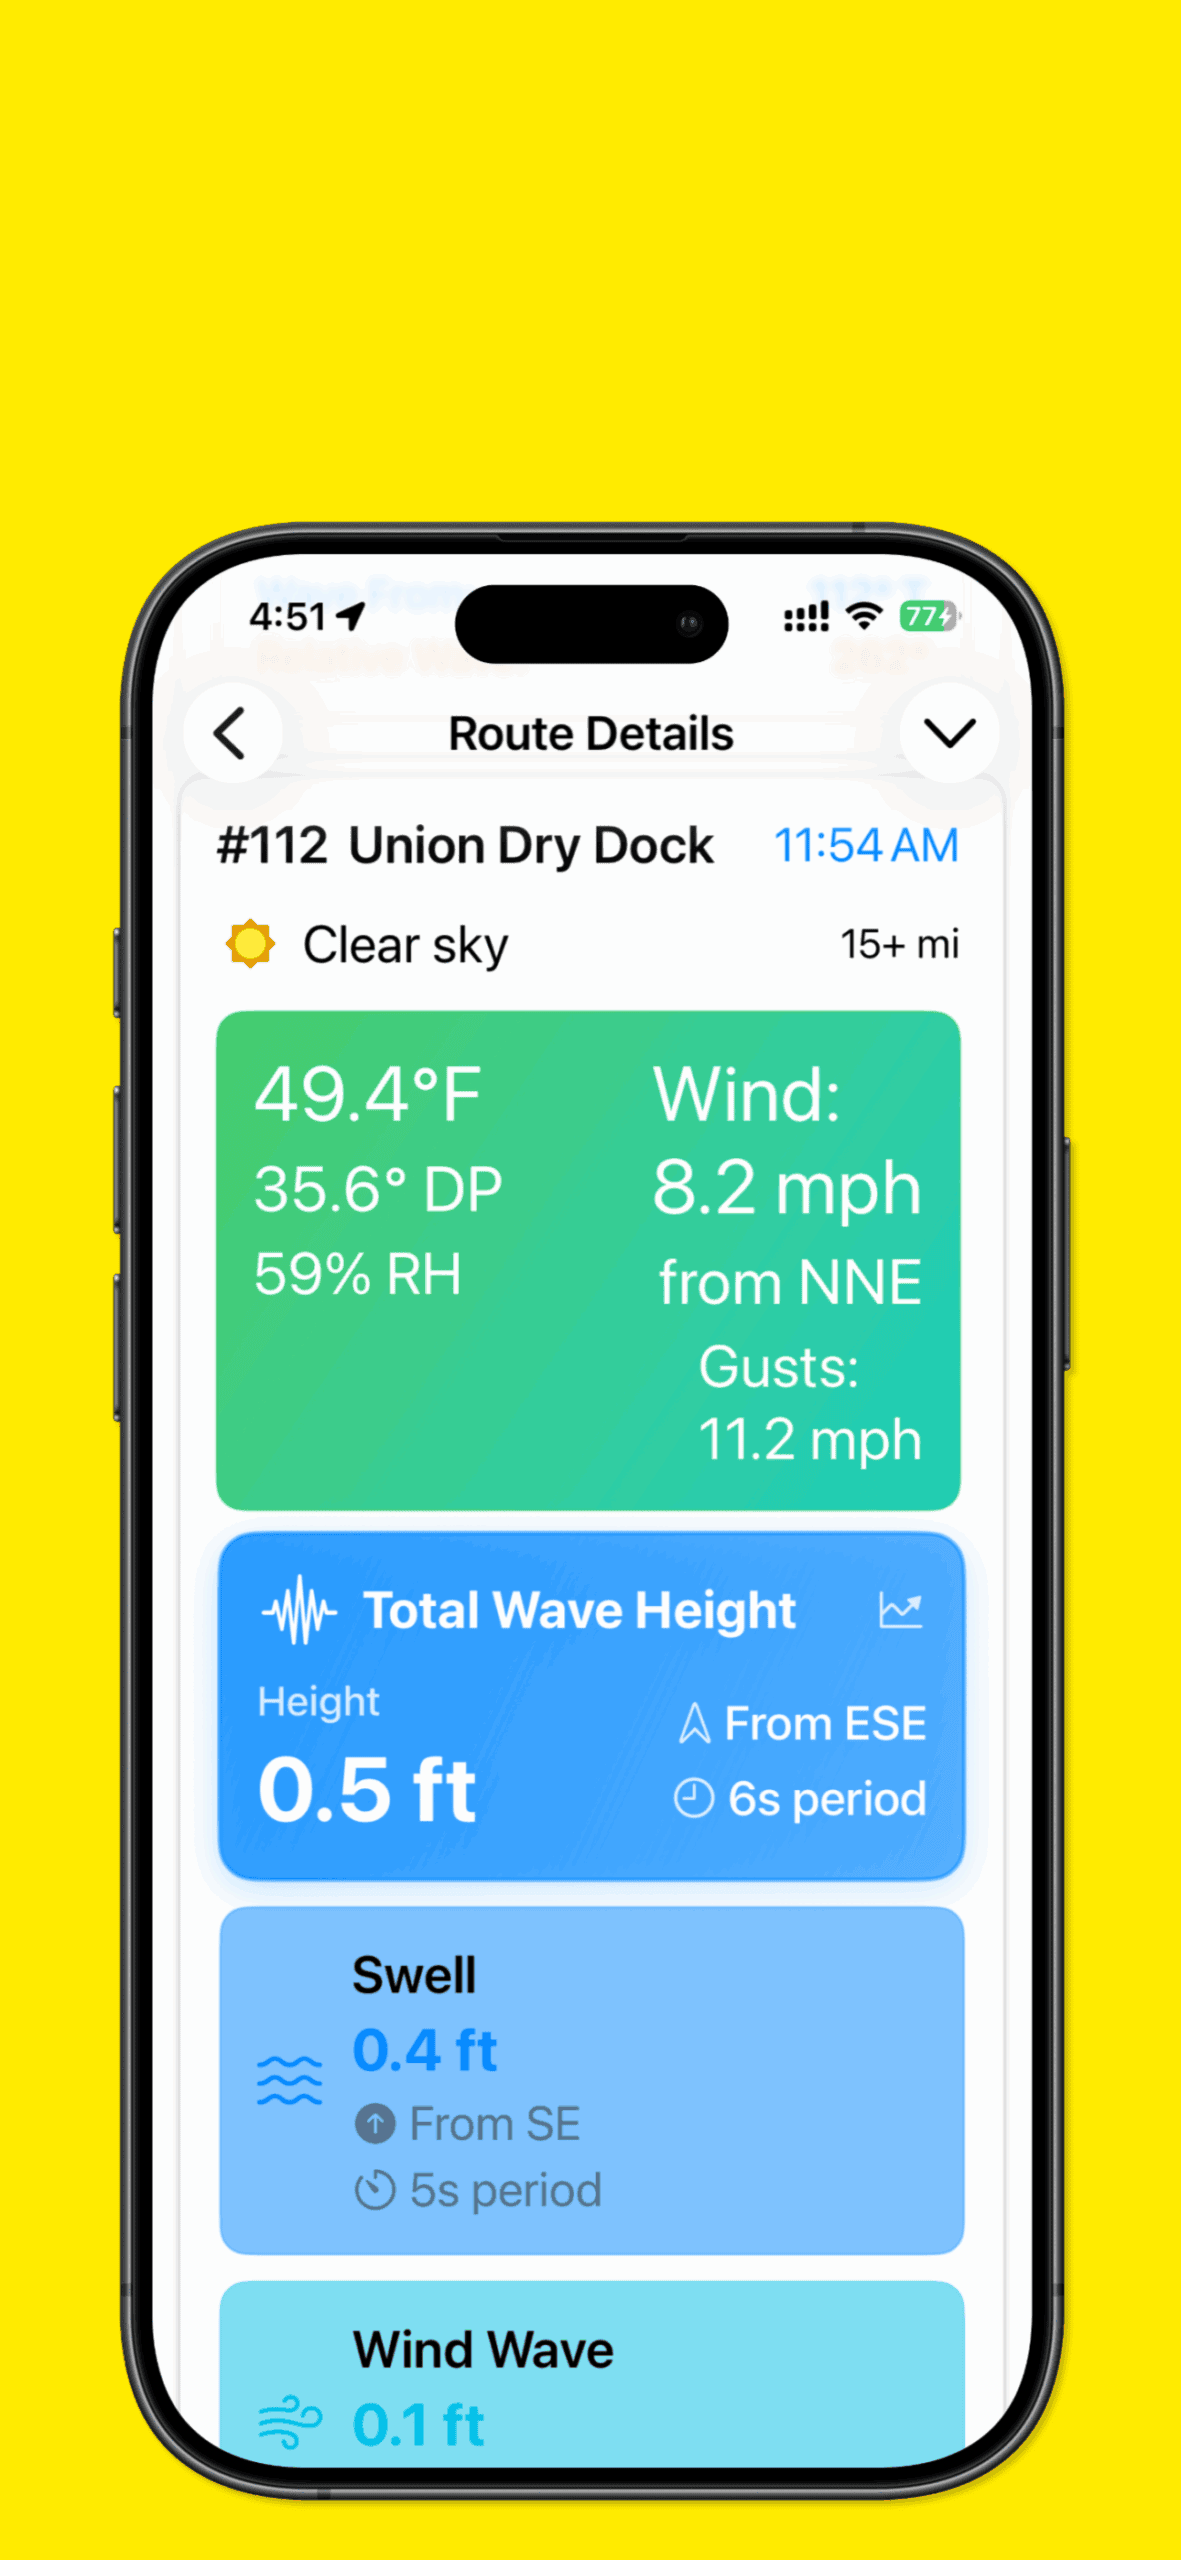
Clear sky icon at route waypoint with wind, wave, and visibility data for safe passage timing.
Combining Icons with Wind and Pressure Data
Weather icons alone don’t tell you whether to go. You need the complete picture. An overcast icon with light winds and stable pressure? Manageable passage conditions. The same overcast icon with 25-knot winds and falling pressure? Stay in port.
In Mariner Studio, always check:
- The icon for overall condition type
- Wind speed and direction for sea state and safety
- Barometric pressure trend for system movement
- Visibility values for traffic safety
- Temperature and dewpoint for fog risk
The icon is your quick reference. The numbers are your decision-making data.
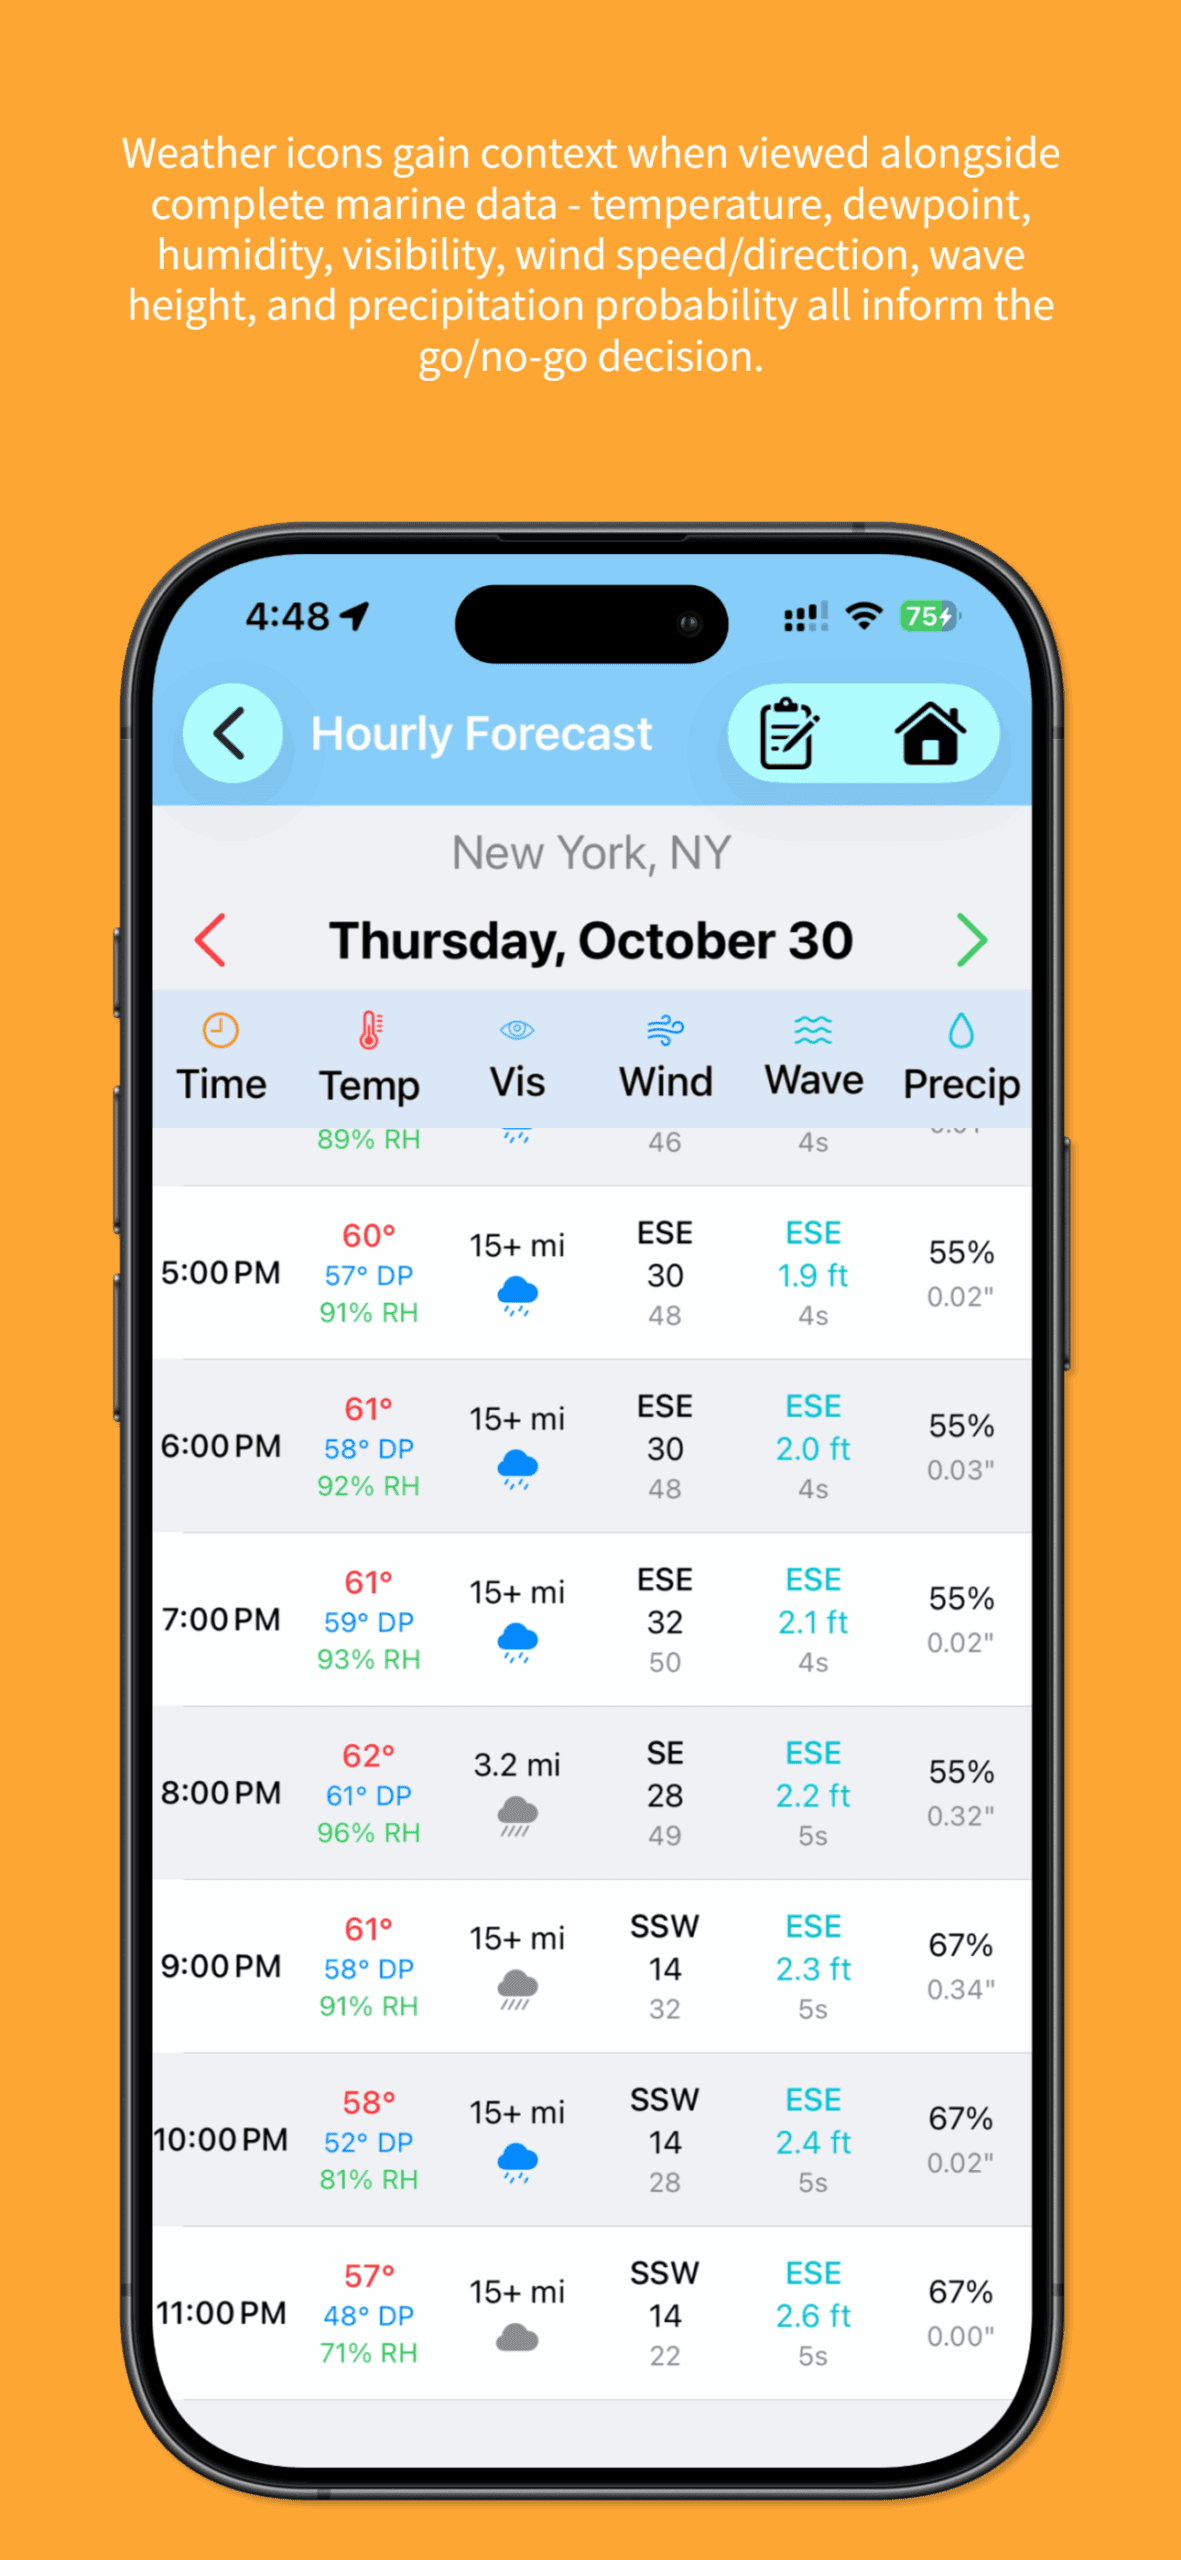
Weather icons combined with temperature, dewpoint, wind, waves, and precipitation probability for informed decisions.
Icon Design and Model Resolution
Mariner Studio’s weather icons are custom-designed interpretations of WMO codes received from numerical weather models with grid spacing of several kilometers. This means localized weather phenomena—sea breezes, land effects, orographic lifting—might not appear in the forecast even though they’re real.
For example, if you’re cruising near mountainous coastline, afternoon heating can trigger thunderstorms that the model doesn’t predict. The icons might show partly cloudy (WMO code 2) while you’re watching towering cumulus develop inshore. Trust your observation combined with forecast data, not just the icons. The custom icon is only as good as the underlying weather model data.
Similarly, coastal fog often forms in microclimates that models don’t resolve. You might see a clear sky icon for a coastal area while in reality you’re socked in with dense fog. This isn’t a failure of icon design—it’s resolution limitation in the weather model itself. The WMO code received was “clear” because the model’s grid cell averaged conditions over several square kilometers. Use the icons as guidance, but verify with observation and local knowledge.
The icons are visual translations of numerical data, not guarantees. They’re tools for interpretation, designed to make complex meteorological information quickly scannable, but they work best when combined with experience and real-time observation.
Best Practices for Icon Interpretation
After years of watching weather at sea, here’s how professional mariners use weather icons effectively:
1. Always view the hourly progression. Don’t just look at the icon for departure time. See where the weather is going over the next 12-24 hours. A clear sky icon now means nothing if thunderstorms arrive in 6 hours.
2. Cross-reference with raw data. Icons are shorthand. Check wind, pressure, visibility, and temperature data to understand what the icon really represents in operational terms.
3. Watch for rapid icon changes. If icons change significantly within 3-4 hours, you’re looking at fast-moving systems or strong fronts. Build extra buffer time into your plans.
4. Learn your local weather patterns. After using Mariner Studio for a season, you’ll notice patterns. Maybe partly cloudy always becomes thunderstorms by 1500 in summer. Maybe fog icons consistently underpredict morning fog duration. Pattern recognition beats individual forecast accuracy.
5. Compare morning forecast to afternoon update. If icons shift significantly between morning and afternoon model runs, conditions are uncertain. When forecast certainty is low, conservative decisions are wise.
6. Plan for time-of-day considerations. Remember that weather has different implications day vs. night. Clear skies at night mean potential fog formation. Thunderstorms after dark are harder to see developing. Factor time of day into your weather planning even if the forecast conditions are the same.
Common Questions About Weather Icons
Q: Why don’t the icons always match what I see outside?
A: Weather icons in Mariner Studio are custom visual translations of WMO codes received from numerical weather models with resolution of several kilometers. Localized weather—sea breezes, orographic effects, isolated thunderstorms—might not appear in the forecast. The icons show the most likely condition for the general area based on model data, but your specific location might experience different weather, especially near coastlines or complex terrain. Always combine icon forecasts with visual observation and local knowledge. The icons are tools, not guarantees.
Q: How far ahead are the icons reliable?
A: Icon accuracy decreases with time. The first 12-24 hours are generally reliable for broad conditions (sunny, rainy, stormy). Days 2-3 capture major weather systems but timing might shift. Days 4-7 show trends rather than specific conditions—use them for planning but verify as your departure approaches. For critical decisions (crossing bars, long passages, anchoring exposure), rely on 24-hour or less forecasts.
Q: What if icons show different conditions at my destination than departure?
A: This is normal and important. Check the icon progression between departure and destination. If you’re leaving in clear weather but arriving in thunderstorms, you need to know whether those storms will reach you en route. Use Mariner Studio’s map long-press feature to check weather along your entire route, not just endpoints. Plan for the worst conditions you’ll encounter anywhere on the passage.
Q: Should I cancel a trip if I see a thunderstorm icon?
A: Context matters. A thunderstorm icon for late afternoon when you’ll be safely in port? Manageable. A thunderstorm icon for mid-passage on an exposed crossing? Serious concern. Check the timing of the thunderstorm relative to your passage plan. Check wind speeds associated with the storms. Look at alternative weather windows. The icon is a warning to dig deeper, not an automatic cancellation—but it’s often a good reason to wait.
Q: How accurate is the fog icon?
A: Fog is one of the hardest conditions to forecast accurately because formation depends on precise temperature-dewpoint relationships that vary over short distances. The fog icon indicates conditions favorable for fog formation, but actual fog development might differ from forecast timing and density. Always check temperature and dewpoint spread—when they’re within 2-3°F, fog is likely regardless of icon. Treat fog icons as “high probability” rather than “certain.”
Q: Why do icons sometimes change significantly between updates?
A: Weather models run on schedules (usually every 6 hours) with updated observational data. When new data comes in, the model recalculates the forecast. Significant icon changes between updates indicate either: (1) new observations that change the model’s understanding of current conditions, or (2) low forecast confidence where small changes in initial conditions produce different outcomes. Large icon shifts are signals that uncertainty is high—proceed conservatively.
Related Features and Learning
Key Takeaway
Weather icons are the visual language of marine forecasting. Mariner Studio combines standardized WMO weather codes with custom-designed icons optimized for maritime use—giving you the precision of global meteorological standards in a clean, scannable format. These icons translate complex atmospheric data into intuitive symbols that help you quickly assess forecast conditions. But icons alone don’t tell you whether to go—they’re one piece of the complete weather picture. Master icon interpretation by watching progression over time, cross-referencing with wind and pressure data, and learning your local weather patterns. The mariner who reads icon trends instead of snapshots, who combines symbols with numbers, and who verifies forecasts with observation makes better decisions every single time.
Start Reading Weather Like a Professional
Mariner Studio puts professional marine weather forecasts in your pocket with clear, accurate icons backed by authoritative data. Download the app and start building your weather interpretation skills today.
Download Mariner StudioFree 14-day trial • Premium $2.99/month • iOS & Android